Adjusting Your Dashboard (Quick Reports)
Please see the following video to learn the basics on how to use the Quick Reports dashboards:
Use-Case Examples For Quick Reports
There are many different ways to use Quick Reports Views to view important data for your business, before trying to do anything more complicated, we highly recommend viewing our organizing mass data guide HERE to understand how to use the filters and edit sources/products inside of Hyros.
please see below for a few examples to help get you started:
Send Weekly Reports Notification
Attribution Gap
Metrics Summary
Top Products Widget Report
Load Top Source data to your Dashboard
Load Main Traffic source metrics based on what is important to your business
Compare LTV by traffic source
Compare data from a single traffic source in different attribution modes
Unique Sales widget
Compare your data with different date ranges
Charts on the Reports
Sharing Quick Reports with Clients and Team Members
You can do this in 2 ways:
1. By sharing dashboards
2. By exporting dashboards as PDF files:
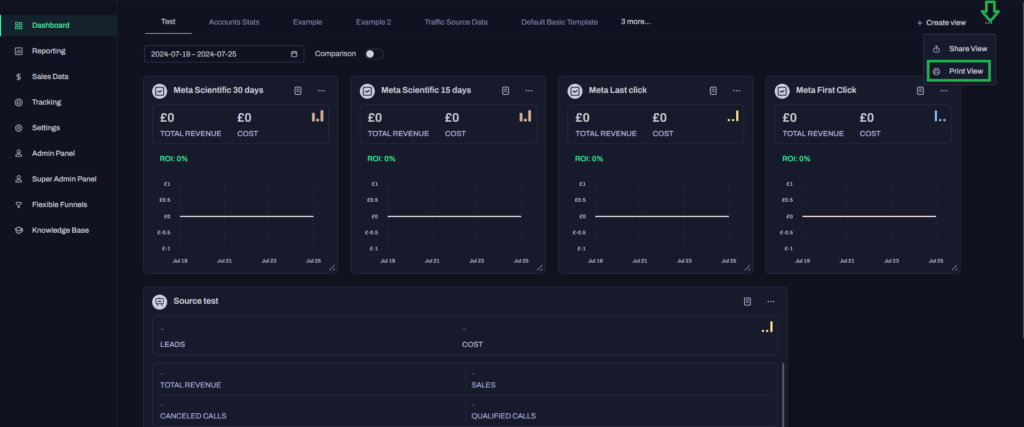
Another great way to share quick reports with your team is to export them as a PDF file, to do this we just need to click on the Print View button on the upper right hand side of our dashboard for the PDF file to be generated and downloaded on your device:

The resulting file will show the same data your dashboard had at the time the document was generated including date range and all active wigets
Seeing Quick Report Data Inside the Chrome Extension
You can also view a summary of data from a particular view inside your ad manager using the chrome extension. Assuming you have already set up the Chrome extension, click here inside the view to see a summary of the data inside of your ad manager:

This will allow you to view your most important data easily whether you are reading your stats inside Hyros or in your ads manager. You should see these metrics at the op of your screen here:

If you have not set up the chrome extension yet, please follow THIS GUIDE for more details.