Start Here – HYROS Basic Training
This is the “starters guide” section of HYROS.
Before we begin or you do ANYTHING, please understand this
HYROS can do SO many advanced things. It can update the AI pixels of your ad platforms. It can track all your social media sales. It can track your email marketing. It can even create algorithms to treat certain traffic sources differently.
HOWEVER UNDERSTAND : If you just master the basics of HYROS you can easily see very large gains in your ad ROI and dramatic savings in wasted ad spend.
Therefore we HIGHLY SUGGEST : You take your time and learn the basics of HYROS first in this section (USING HYROS) before moving onto the advanced use section.
This guide will show you how to check your basic sales stats in Hyros. Let’s begin with the most basic use of HYROS and move onto your specific business model.
HYROS Basic “How To Use” Training
In this quick training, I will be breaking down how to use HYROS to find out what ads are generating your customers.
Why do we want to do this? If you know what ads and ad spend is truly generating your customers you can simply spend more on those sources to make more revenue.
If you just nail this ONE thing in HYROS your business will grow immensely.
If you want to do this, first ensure your tracking has been confirmed by your onboarding manager.
After tracking is confirmed tracking your sales is easy. Here’s how to do it.
Step 1: Reading Your Basic Sales Data
Video Guide
Written Guide
Proceed to https://app.hyros.com/#/mh/finance. Once there you will see your basic sales and leads reporting. This is a hyper simplified view of your sales and leads entering the system.
You can switch between sales and leads by clicking the “Sales”, “Leads” or “Calls”.
Sales Tab
Sales are people that have bought something from you. In this tab you will see their ORIGIN email, their first click, their last click (indicated by @tags) and the product purchased (indicated by $tags).
You can click on the customer email to see even more data about the user such as all their sources, clicks, IP address, phone number and much more. We will get to this in advanced use.
ORIGIN EMAIL DEFINITION : An origin email is the first email the customer used when they entered tracking. Since users frequently change emails HYROS tracks users by other indicators such as IP/browser finger print. If the user is recognized but the email is different HYROS will still collect the new email BUT will attach sales and @tags to the first used email AKA the ORIGIN email.
@tag DEFINITION : @tags are tags on a user that begin with @. They indicate the application of tracking. For example : when plugged into your Facebook ads your @tags will be generated based on the Facebook Adset the click came from. If the adset name is “DOGS” the user will be tagged with @dogs.
$tag DEFINITION : $tags are tags on a user that start with $. They represent a purchase and also assign a dollar amount to the user. For example if a user purchases a product named “Cool Product” for 19 dollars the user will get the tag $coolproduct and 19 dollars in value added to their customer profile.
Leads Tab Explained
The LEADS tab will show all emails that have entered your system and their join date. It will also show their value. Like the leads tab you can see the user’s tags. You will also see the origin email in the email profile in the top right-hand corner.
You may also see !tags. These tags tell you where this email was tracked at.
!tags DEFINITION : !tags are tags that begin with !. These tags are to show the parts of your business the customer interacted with. While they may seem similar these are VERY different than @tags. For example if a person buys from your E-Commerce store they will get the tag !shopify. If a person opts into a certain funnel they will get the a !funnelname tag. This tells us what PART of the business a lead was generated from or interacted with NOT the source of the lead.
Calls Tab Explain
Your CALLS tab will display people that have entered your HYROS system via a call booking system. This tab will only be relevant if you are running a call funnel.
NEXT: Let’s Check Your Ads Stats and Sales
Video Guide
Written Guide
Inside your Hyros Account, click the “Reporting” tab.
This will bring you to your “Report Board”
Reports Board DEFINITION: The reports board allows you to generate highly customizable reports that display your businesses sources and sales via multiple different attribution models.
Once you are looking at your “Report Board” it will show a menu that allows you to select what data to pull.
You will see a list of attribution modes, to start with select “Last Click”.
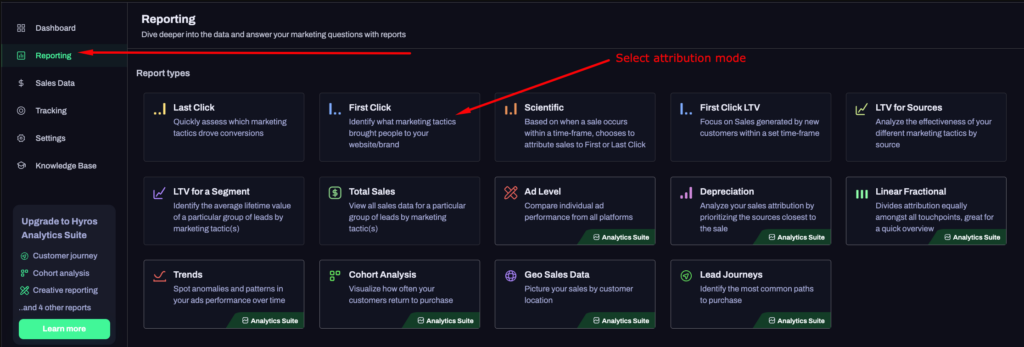
LAST CLICK MODE DEFINITION : When the Report Board is in LAST CLICK mode it will attribute sales in your business to their last source clicked. For example, if the last thing they clicked was a Facebook adset named DOG, the sale will be attributed to @dog.
Next, simply select the date range and click “generate report”.
WARNING : Before you get excited and click “SHOW ADVANCED OPTIONS” we highly suggest leaving your report generation menu in its base from. This is more than enough for most businesses.
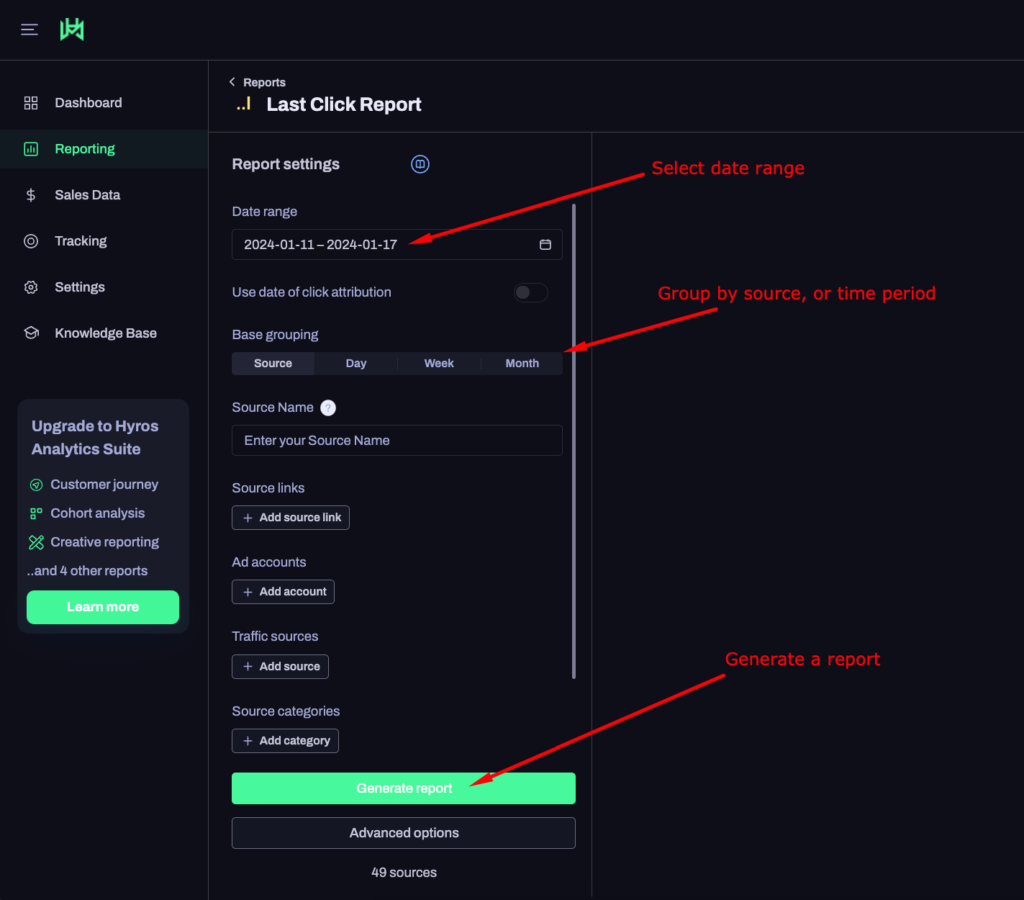
HYROS will now generate a report. We cover how to read this in a basic way in the above video, but here is a summary:
HYROS will display all your sources and sales attributed to those sources. It will also display sales marked as NO SOURCE. In later training, we will show you how to read your NO SOURCE data to isolate where the sales came from so you can attribute them properly.
You can add columns to the board and order it by clicking the metrics at the top of the chart. HYROS will also show what Facebook and Google reported so that you can compare results.
If you only have one traffic source such as Facebook only, HYROS should consistently beat the source in reporting. As you ad traffic sources or scale-up ad spend Google and Facebook will often begin to misattribute sales. This means they will take credit for sales they did not actually generate an accident OR they will attribute the sale to the wrong ad.
This is caused by device changes and FB/Google’s view/click attribution.
This concludes checking your basic sales stats. Let’s move onto the next section that will cover how to use these stats to actually grow our ad revenue.