This will post will show you the basics of using HYROS’s data to grow and scale your ad campaigns.
Using HYROS Data To Scale Your Ads
Scaling your ads with HYROS data is shockingly easy. In the video below I will cover this in great detail. Here’s a summary though.
When you want to scale your ads we suggest loading up your report board over at least 3 days of data. Longer time frames provide a more consistent look at your stats since ad sales can be drastically different day to day.
NEXT: Order your ads by REVENUE by clicking the REVENUE metric at the top of the chart. This will order your ads by the revenue generated.
In each row, you will be able to see the ad set name for Facebook and the Campaign name for Google. If you want to see more info go to columns above the report and ad the metrics you’d like to see. Campaign/Ad set ID and Facebook campaign name are popular.
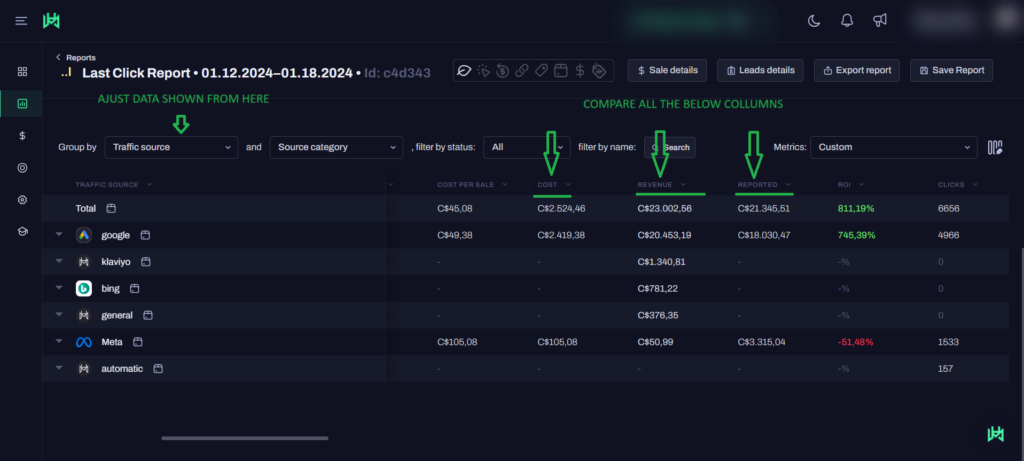
To Grow Your Ads : We then suggest to look at the REPORTED column and compare it to the REVENUE column. REPORTED will be what your ad platform attributed, REVENUE will be what HYROS caught.
Often ad platforms will miss or attribute sales to the wrong source.
Look for ads that have a high ROI in terms of REVENUE to COST. These will often be missed in ad platforms that miss sales.
NEXT: If the ads are profitable simply find the ad set or campaign and increase the ad spend! If you have a lot of data you can get the ad set ID or campaign ID by clicking on the traffic ICON on the right side of the board. You can also display this in columns. Use the Ad set ID or Campaign ID to quickly find the right ads IF the name is not enough to easily find it.
Let’s Go Over This In Video Form
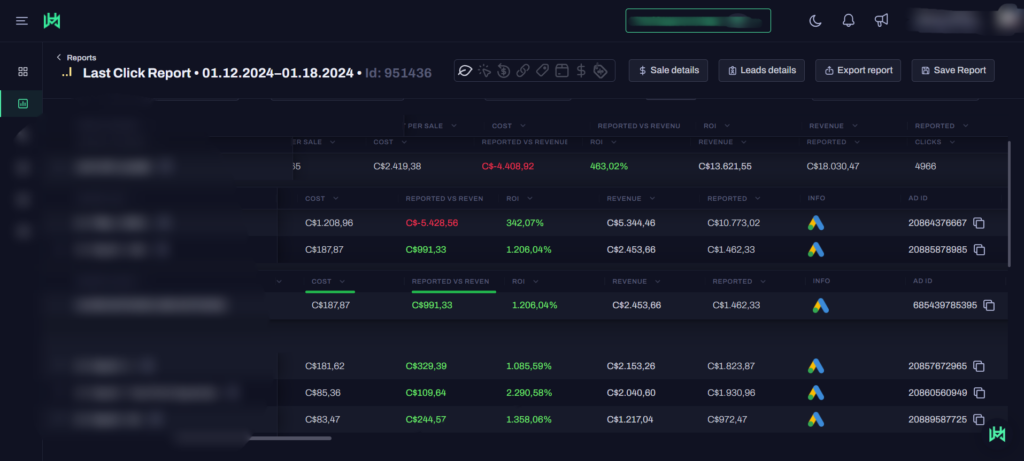
Additionally, we can also check the “Reported vs. Revenue” collumn that will show us the Difference between Hyros and your Ad Platform. A positive value means that the Ad Platform is under-reporting, and Hyros managed to capture additional sales. A negative value means that the Ad Platform might be over-reporting and tracking additional sales that belong to a different Ad or Ad Platform.
In the example below we can clearly see the Cost and data and thus the positive difference tells us that Hyros as tracked more sales for this ad the Google reports back which is a clear example of how Hyros brings in an ROI.
That is enough for now. We will go into going deeper into board stats in the ADVANCED USE section.
NEXT, let’s go into how to use our reports to start saving money and eliminate waste from our ads.
Click here to go to “LEARN TO USE HYROS PART 4: Using HYROS To Save Money”